TLDR; Stablecoins have been all the rage in 2019 – arguably one of the few products on the blockchain that have found product-market fit. There are over 30 stablecoins live on Ethereum. But picking one stablecoin over another can be challenging. We need a deeper understanding of stablecoins to analyze investment returns, build portfolios and reduce risk. We explore the concept of velocities – an economic signal to determine the activity of an economy. Higher velocities correspond to more activity and vice-versa.
Background assumptions
We assume the reader is already familiar with stablecoins. For conciseness, we omit the introductory material (the "what" and "why") on stablecoins. A lot has already been written on the topic. There are many ways to stabilize a stablecoin: 1) Algorithmic or "Non-collateralized" 2) Crypto-backed 3) Commodity-backed and 4) Fiat-backed. An analysis of the stabilizing mechanism is outside the scope of this blog post.
Cryptoassets can be broadly divided into productive and non-productive assets. Productive assets can be reasoned about just like equity, bonds or real-estate in the real-world. Non-productive assets are typically medium of exchange tokens and stores of value like Gold/Bitcoin. We consider stablecoins to be non-productive assets and therefore can use the equation of exchange to understand it.
All data was sourced internally from Covalent's product and we hope to open this dataset to the broader community in the coming weeks.
The velocity equation
A simple definition for velocity is the number of times money moves from one transaction to another. The equation of exchange gives us
$$M \cdot V=P \cdot Q $$
where,
- M = money supply
- V = velocity
- P = price
- Q = quantity
DAI Stablecoin on-chain analysis
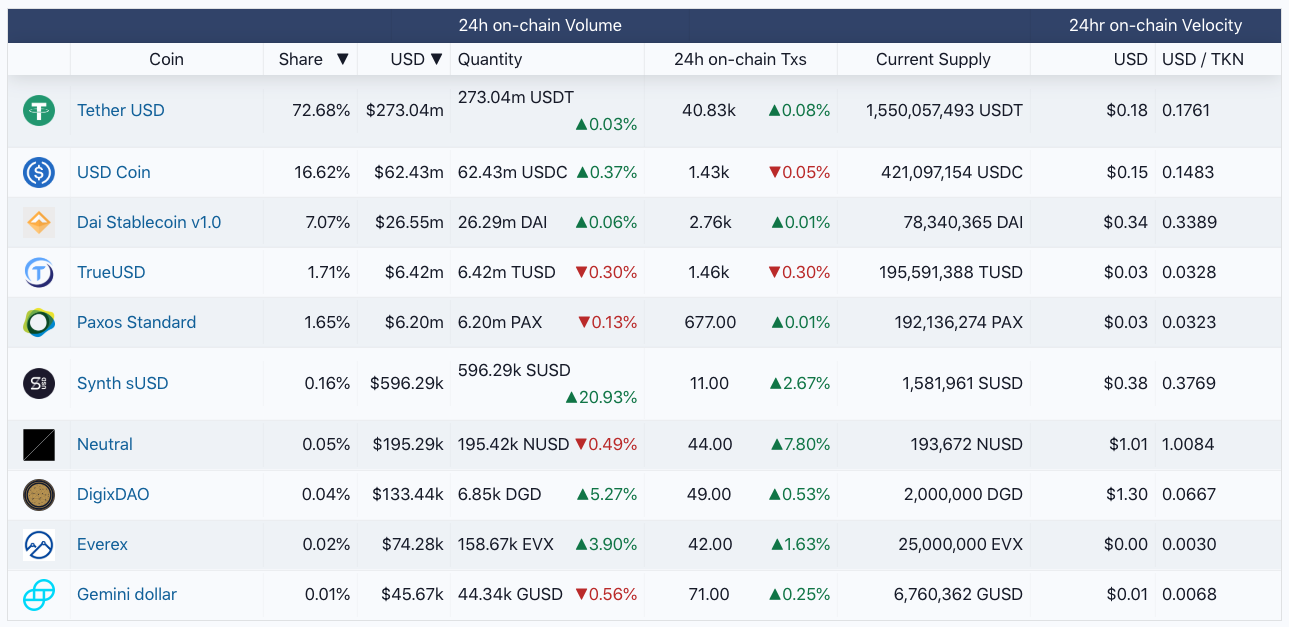 Preview of Covalent's upcoming stablecoin dashboard.
Let's analyze the DAI stablecoin. DAI – a crypto-backed stablecoin pegged to the US dollar – is generated through a mechanism whereby users can put down their ETH as a collateral and mint DAI in return. The stability of DAI is maintained through a "stability fee". If DAI isn't able to to hold onto its peg, the stability fee is used as a lever to increase / decrease supply in order to incentize users to open new loans (minting DAI ➡ increases DAI supply) or close loans (burning DAI ➡ decreases DAI supply).
The last few weeks have been tumultuous in the DAI ecosystem with the Maker stability fee being bumped to 20.5% on July 13th. A lot of loan holders moved their loans to other venues like Compound with better rates.
Let's study what's happening to DAI in four charts.
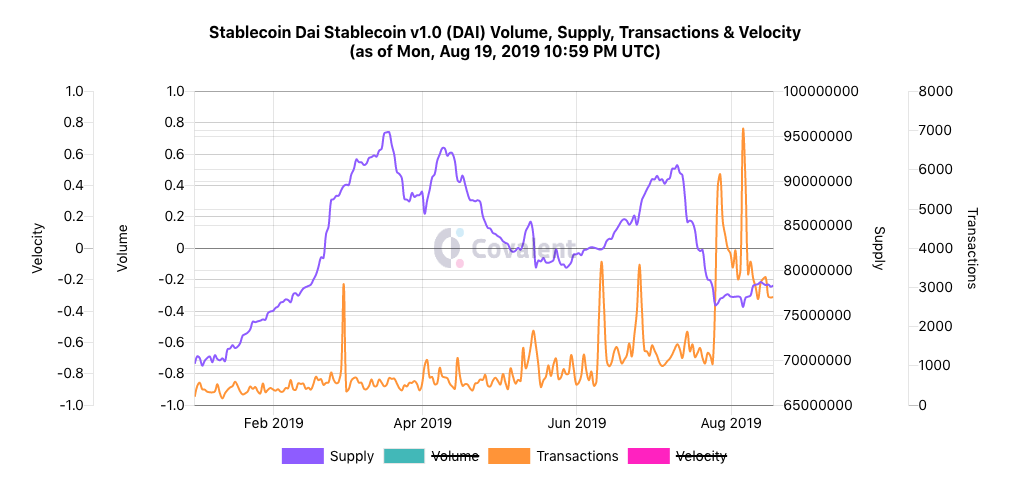
Chart 1: Supply has dropped by 20%.
This is to be expected as people as burning DAI when they close their Maker loans and move them elsewhere.
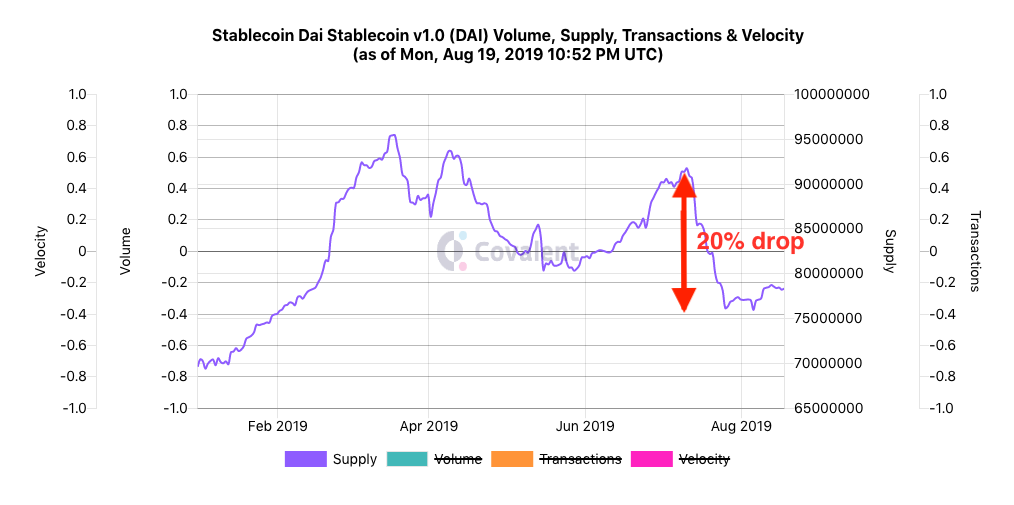
Chart 2: On-chain volumes spiked right around the time the stability fee was hiked.
The stability fee was hiked to 20.5% right around 13th July. For about 10 days after, we were seeing higher than normal volumes.
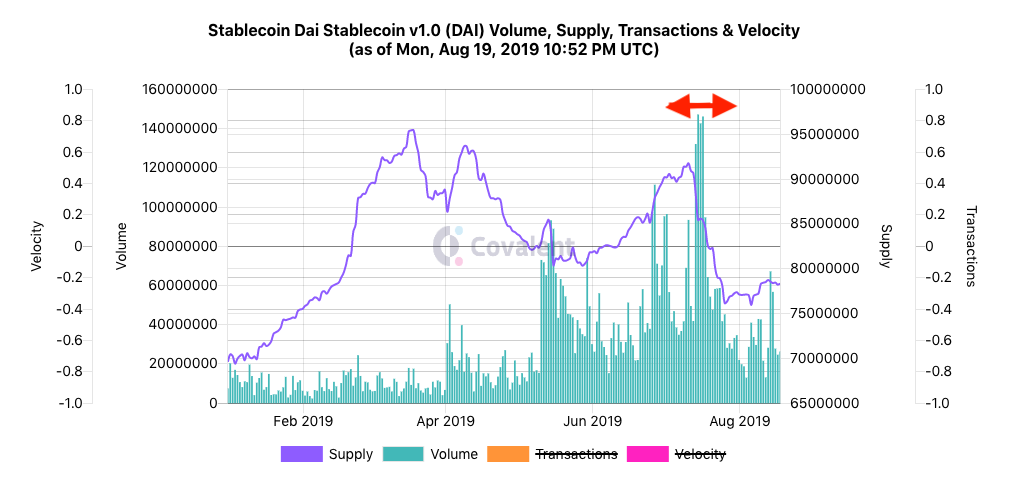
Chart 3: Transactions have permanently shifted upwards
Transactions jumped dramatically around 25 July, possibly because of Coinbase's campaign to earn DAI through opening a Maker loan. No dramatic changes to the DAI supply.
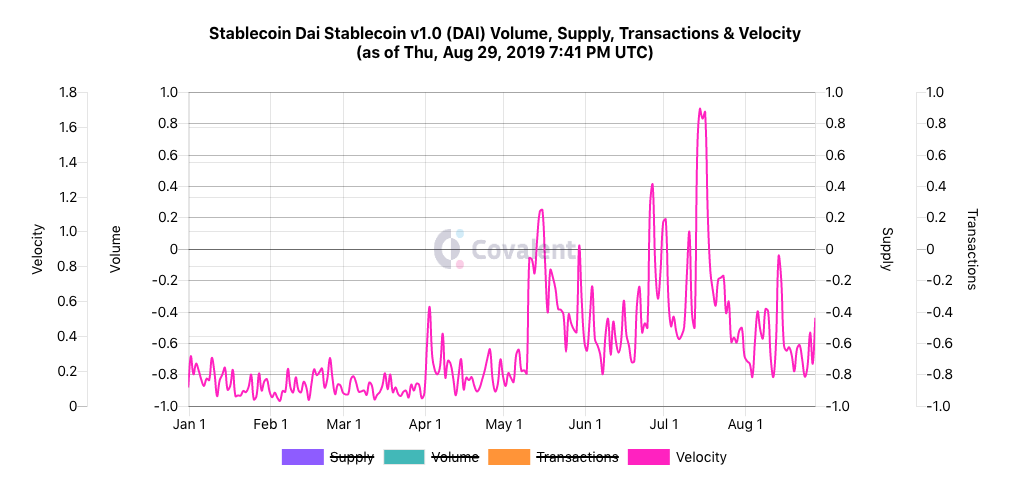
What has happened to DAI's velocity?
After the temporary spike the week of July 15, the velocities are reverted back to what they previously were. Intuitively, those transaction counts have gone up, the volume per transaction have gone down leading to a lower velocity. The velocity of a currency in an economy is a nice normalizing metric that can be compared across economies.
Follow up analysis
An analysis of a static snapshot is useful to understand a point in time. You'll need real-time, live data to see how the story is unfolding – that's the purpose of our stablecoins dashboard. Here are two examples where the data can point to an interesting narrative.
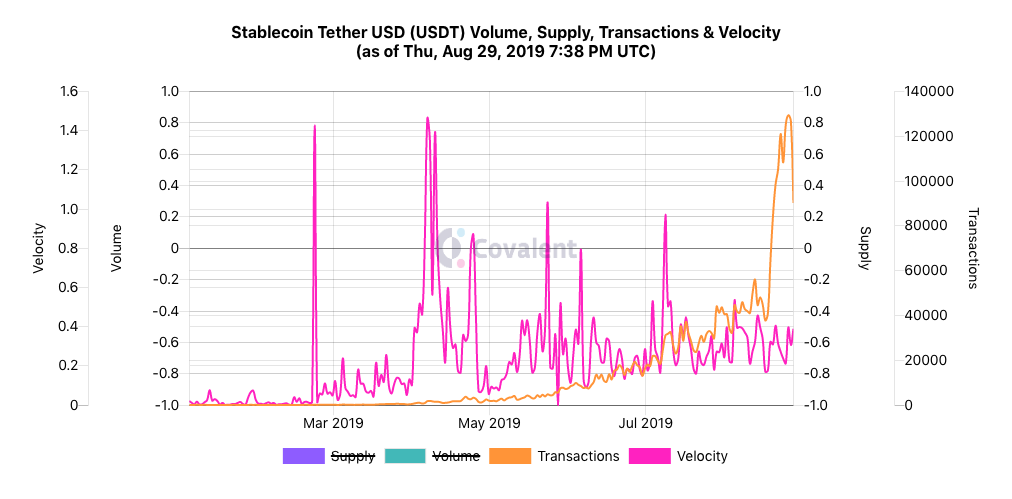
1. Massive jump in Tether transactions
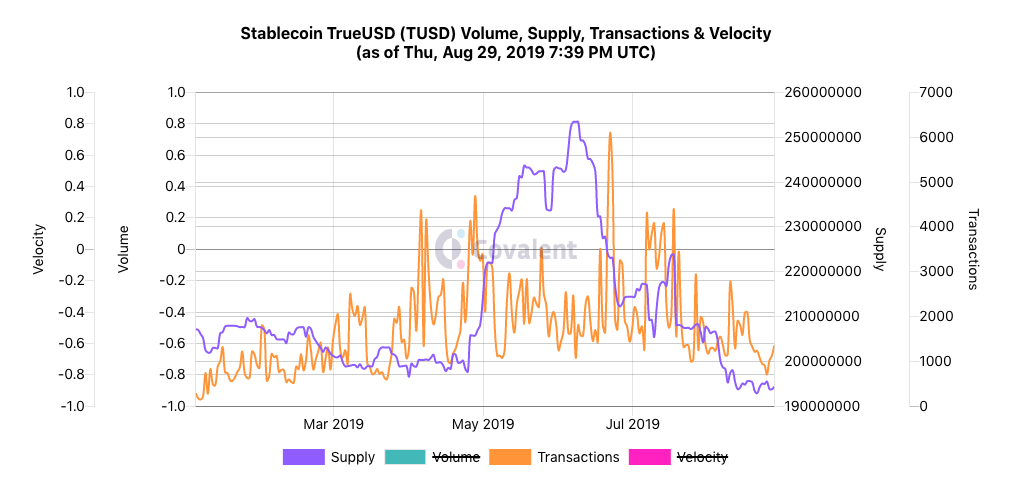
2. Big drop in TUSD supply without no corresponding change to transactions
